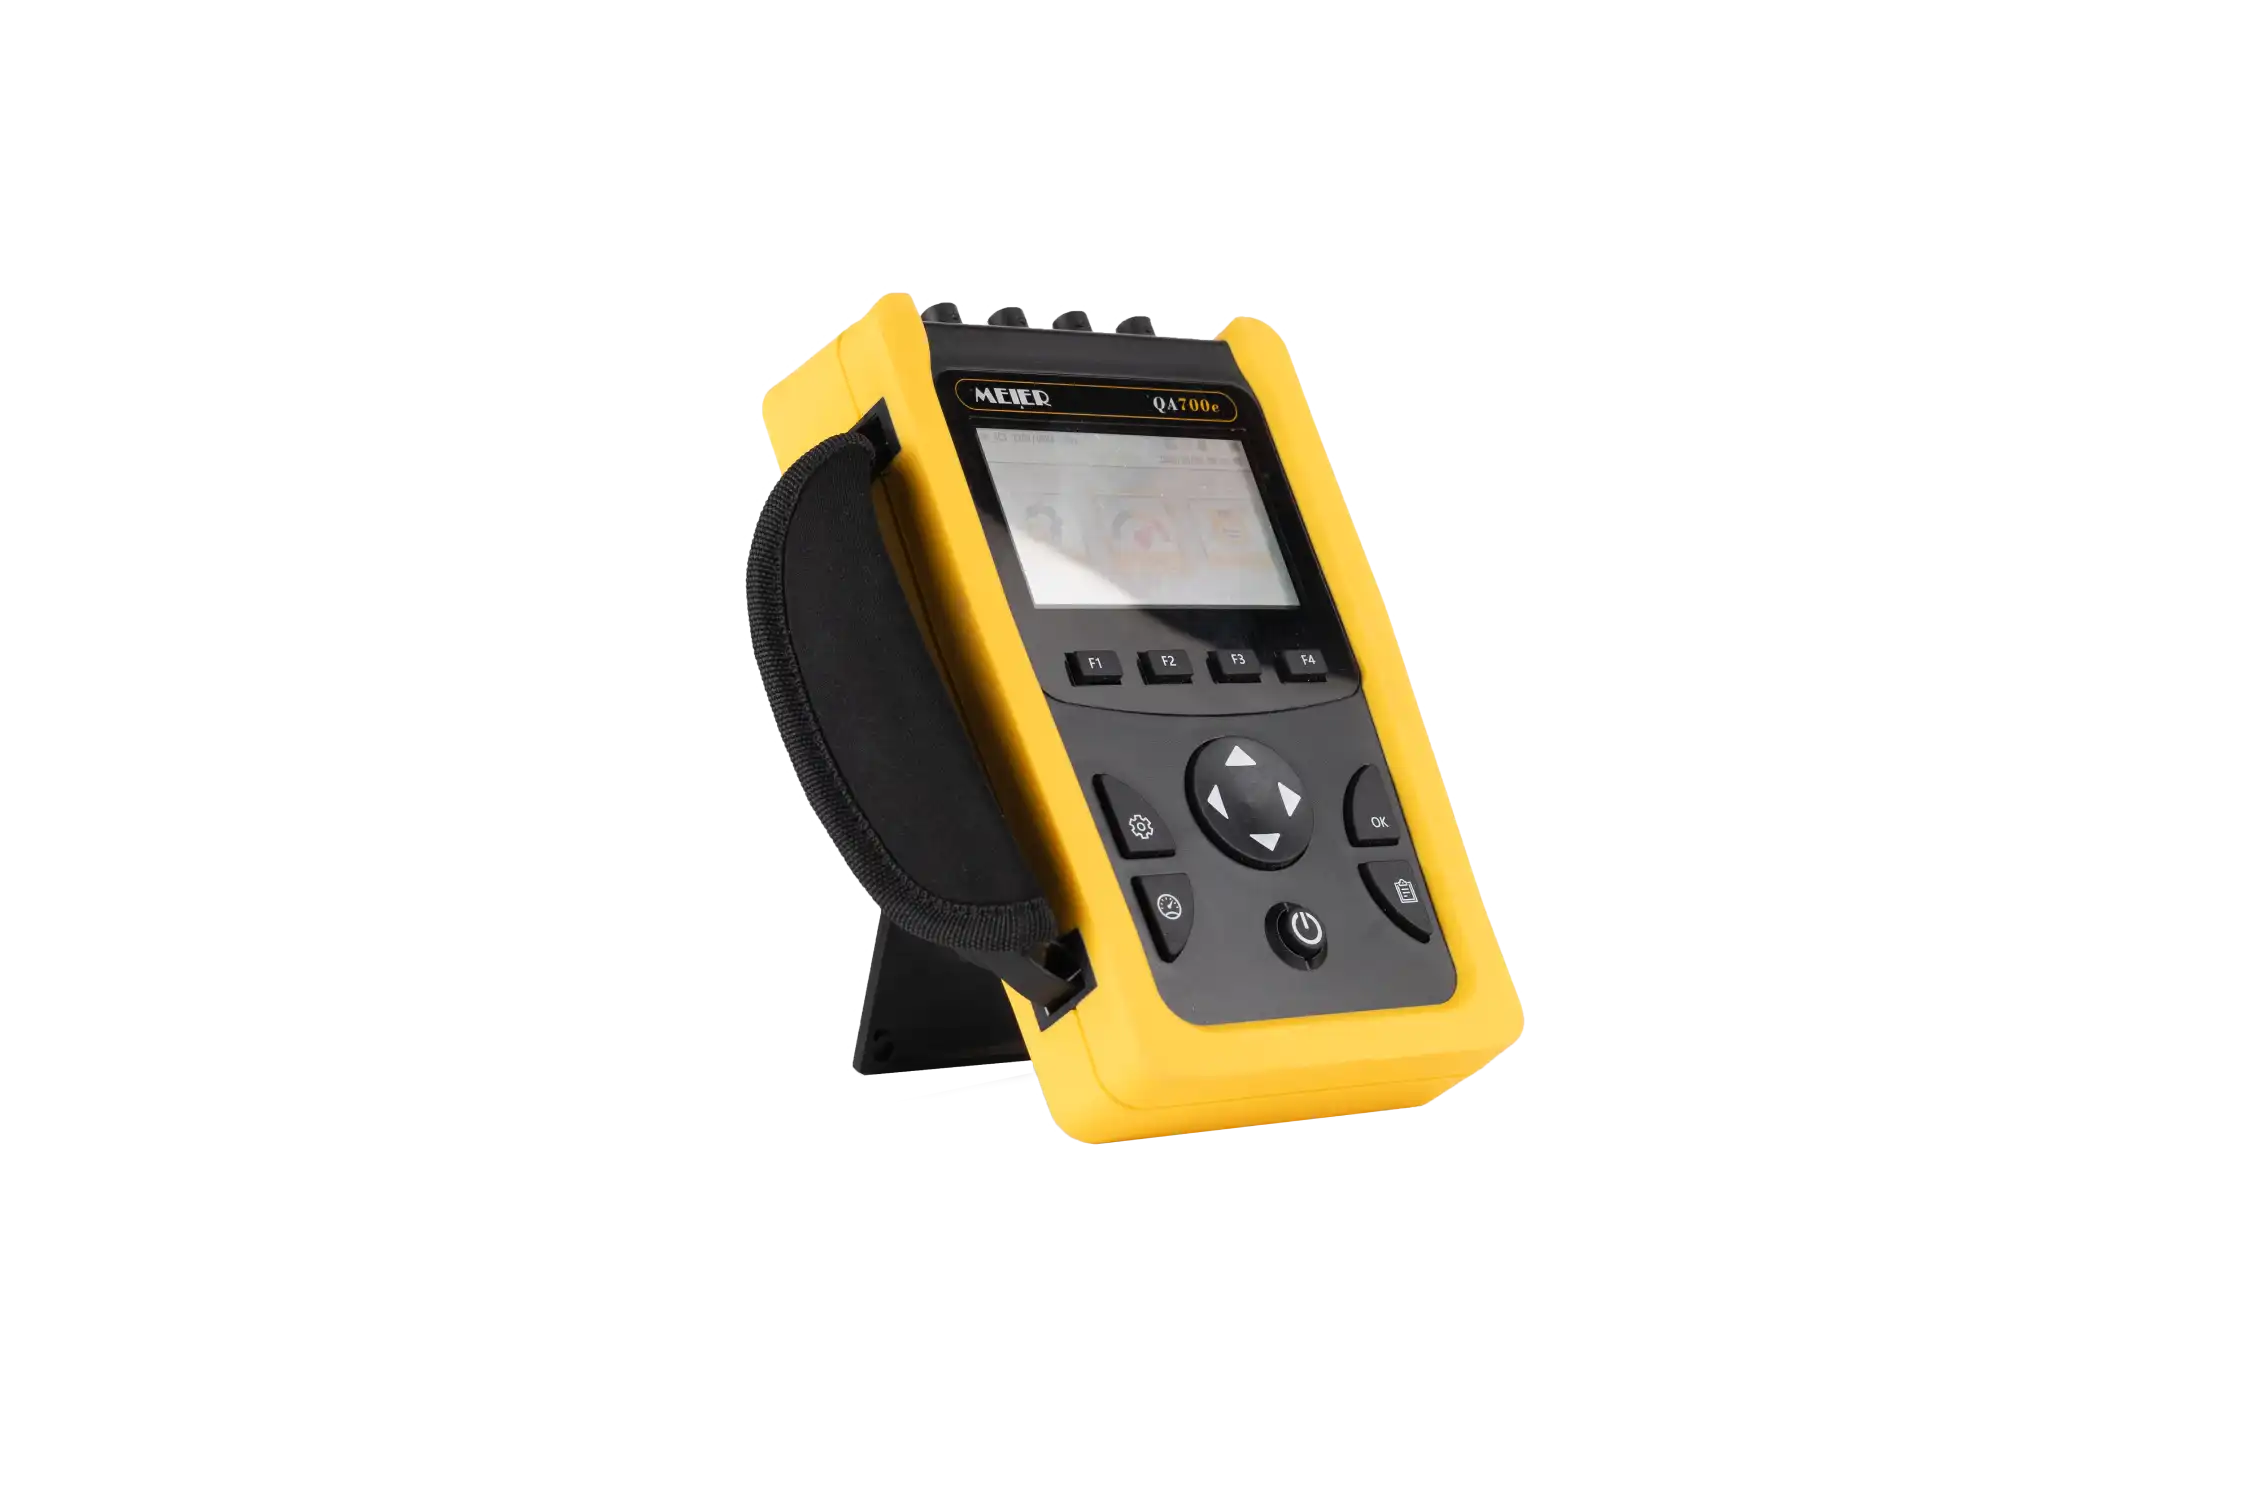
QA-700E
Portable network analyzer
Portable power network analyzer for measurement in both low-voltage and high-voltage installations. Ideal for energy audits and analysis of power network quality. Comes with powerful data analysis and processing software, M-Visu.
Standards:
Description
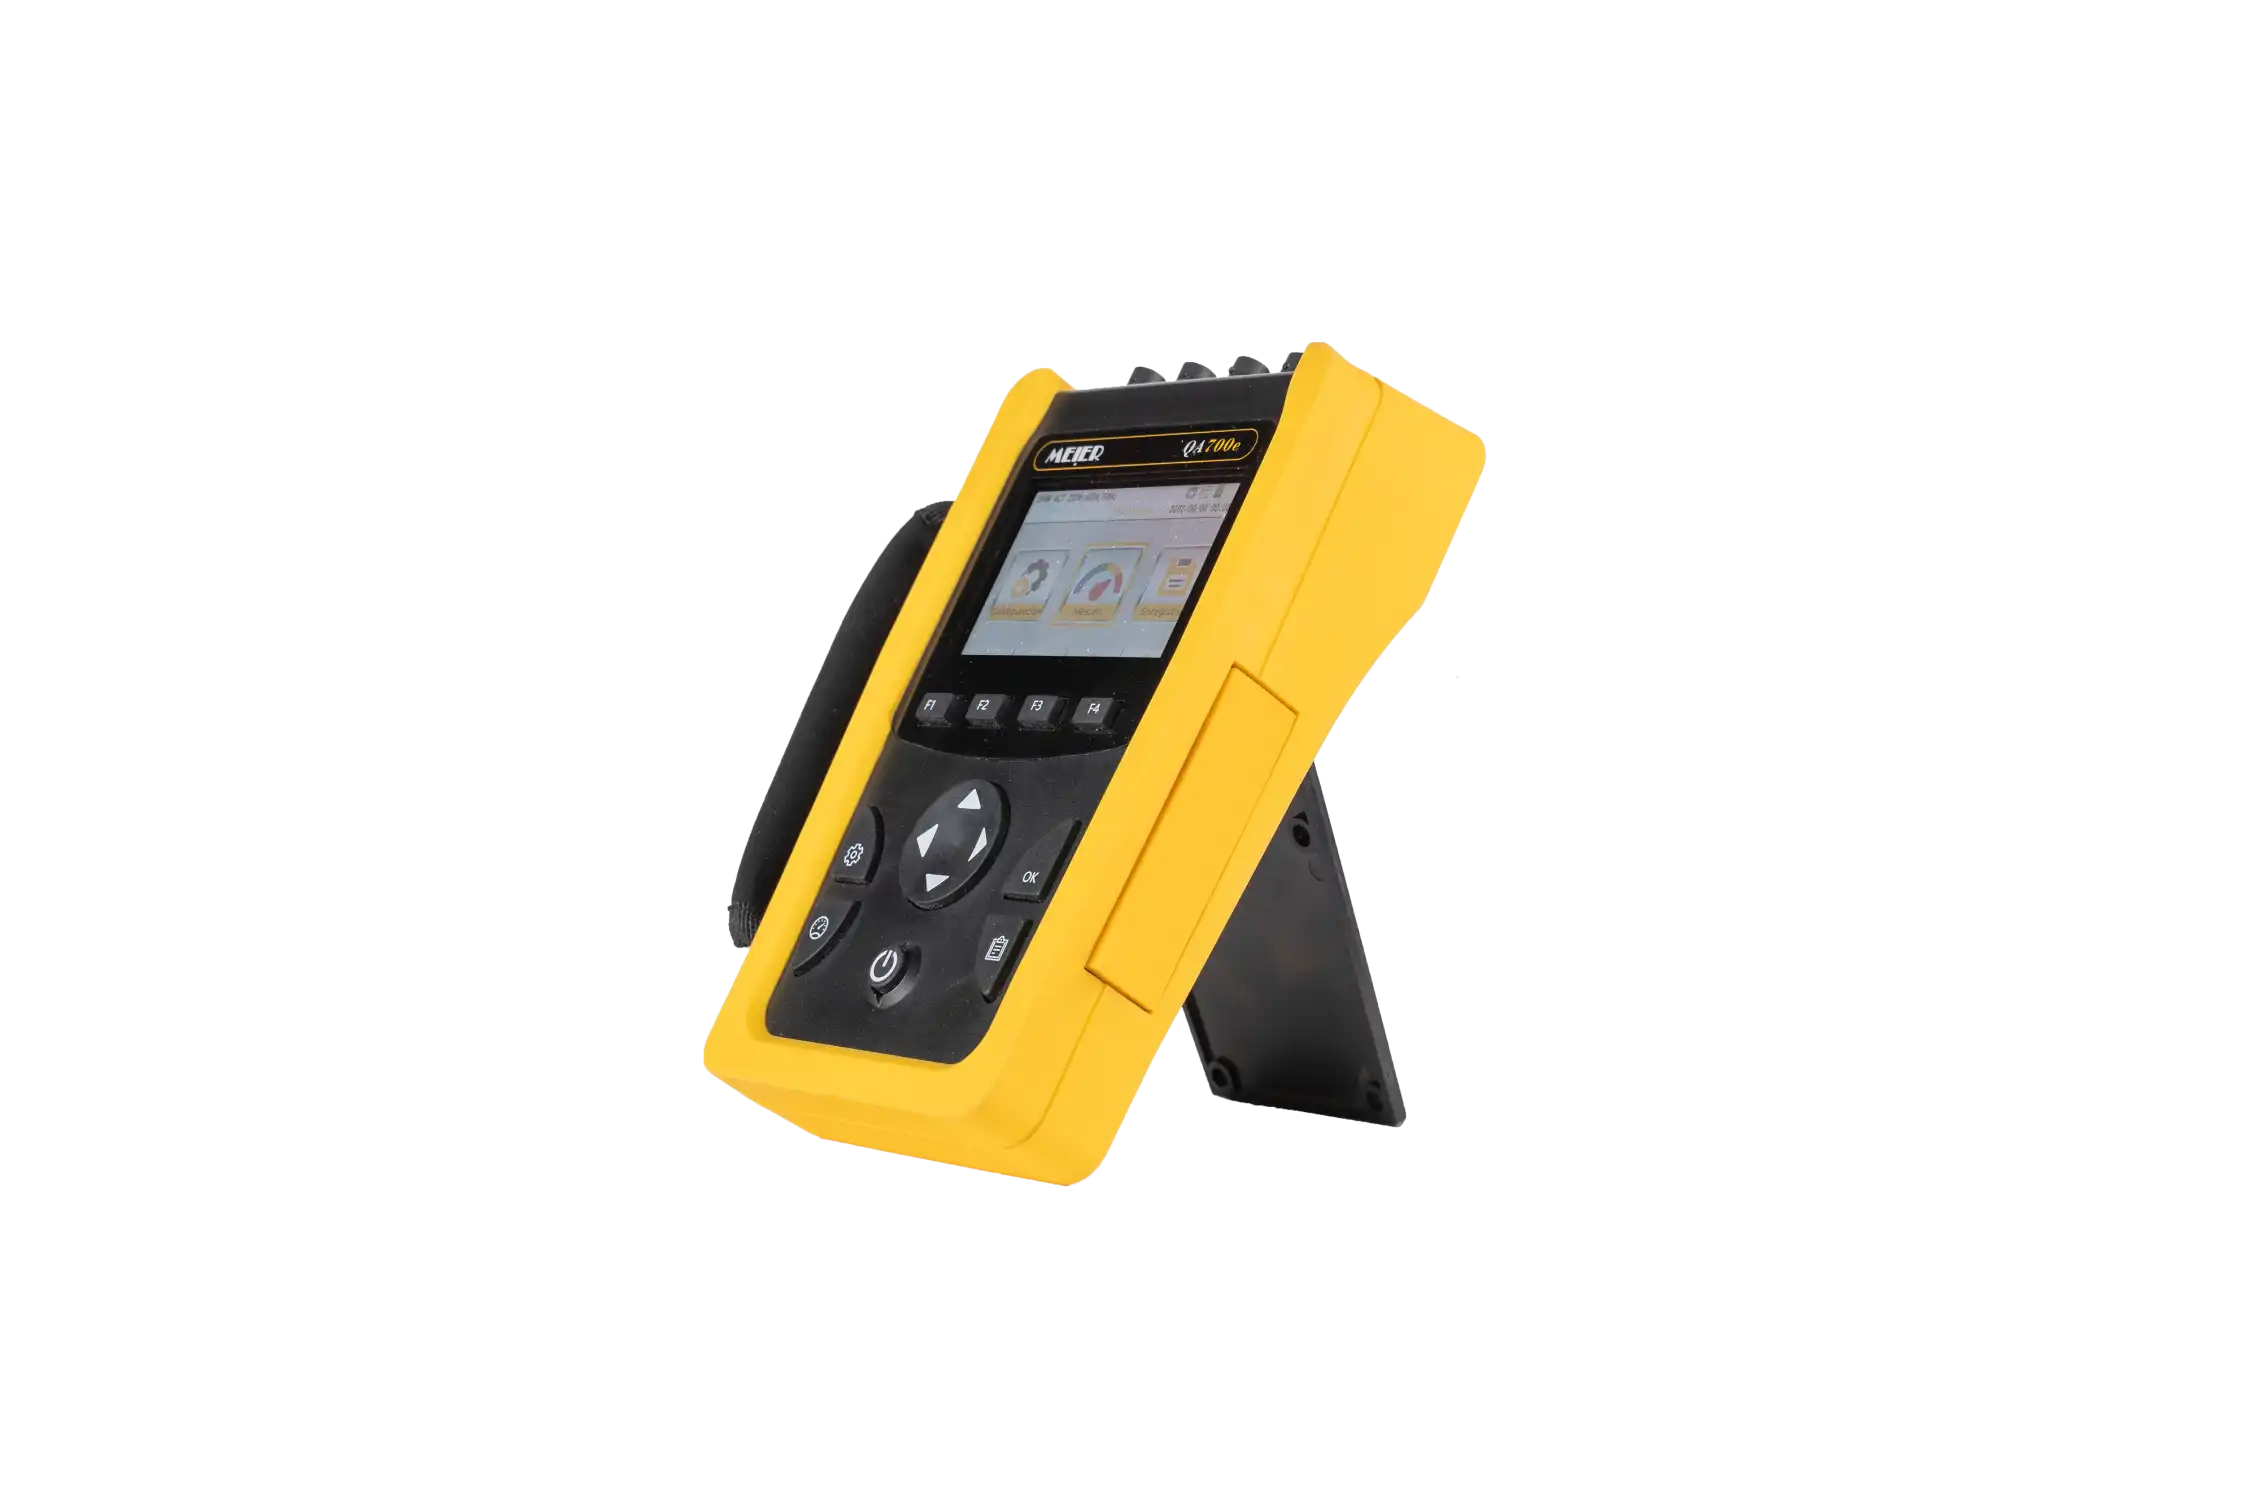
The QA-700e portable network analyzer has been designed for a wide range of applications. In addition to quickly locating the cause of network disruptions, it is the perfect tool for energy management audits in accordance with ISO 50001.
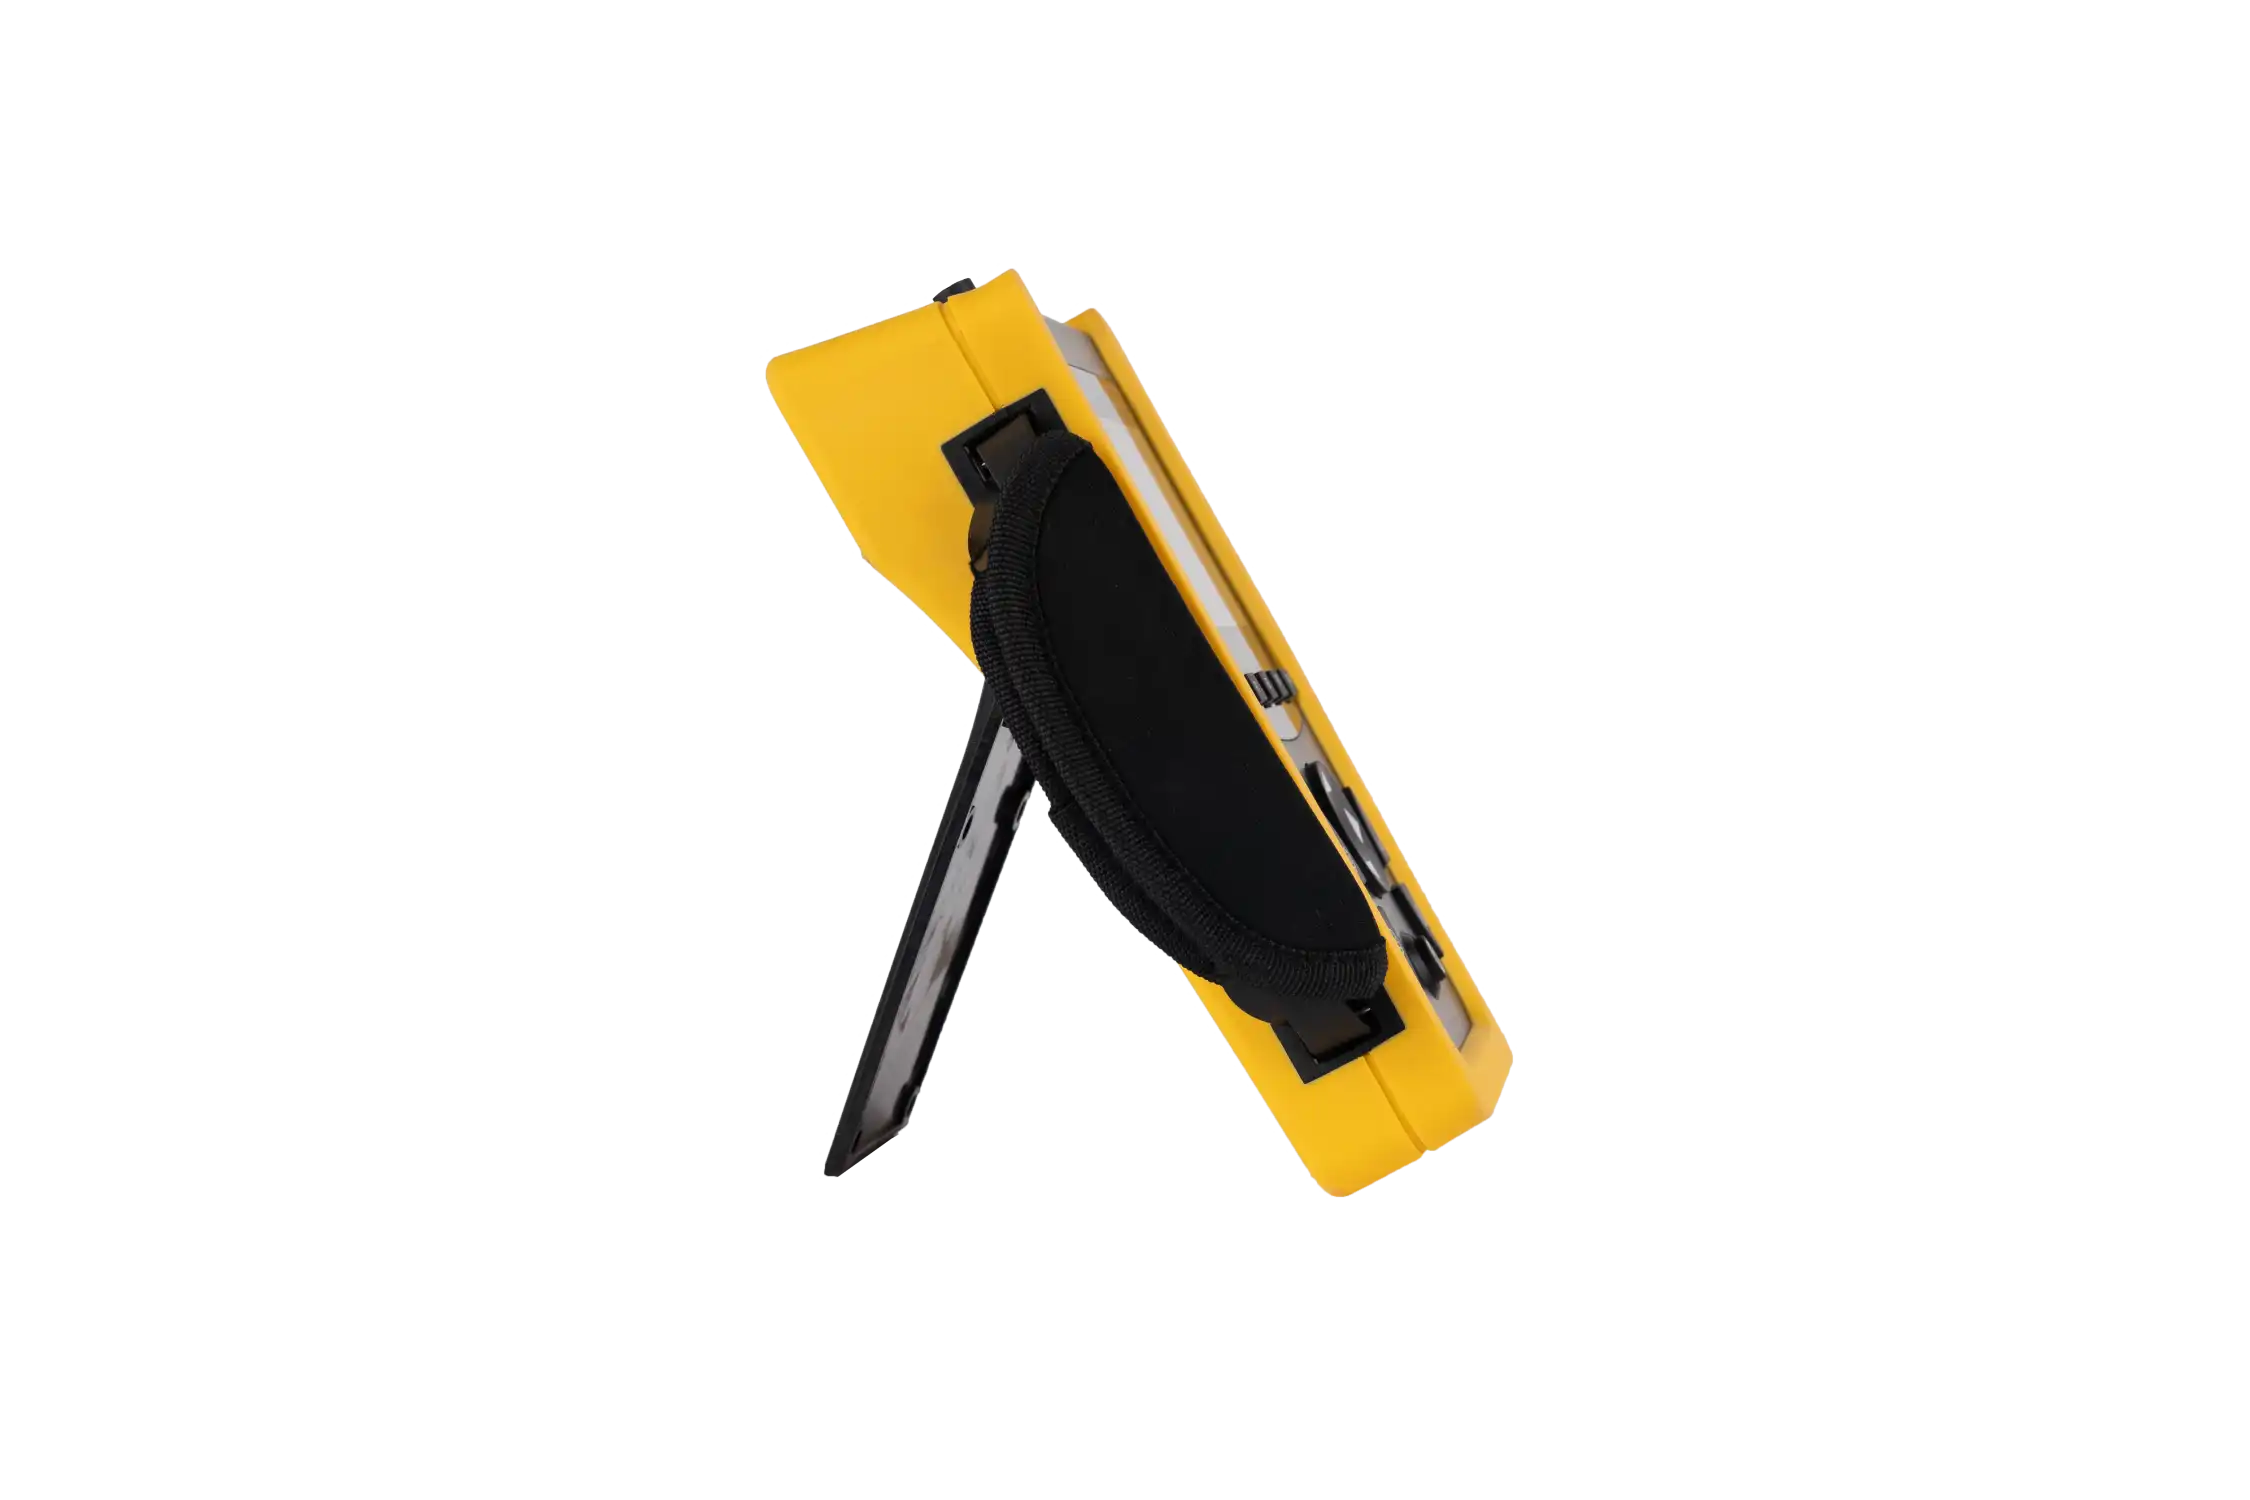
Featuring large memory for data storage, it has been developed for measurements in low, medium and high voltage networks and is ideally designed for mobile measurement operations in harsh environments and very confined spaces
The stored data can simply be downloaded to a USB key in csv format (directly usable via Excel) or fully analyzed by the software provided.
| Scope of use | |
|---|---|
| Applications | Network Analysis, Energy Measurement, Power Quality Analysis |
| Installation | |
|---|---|
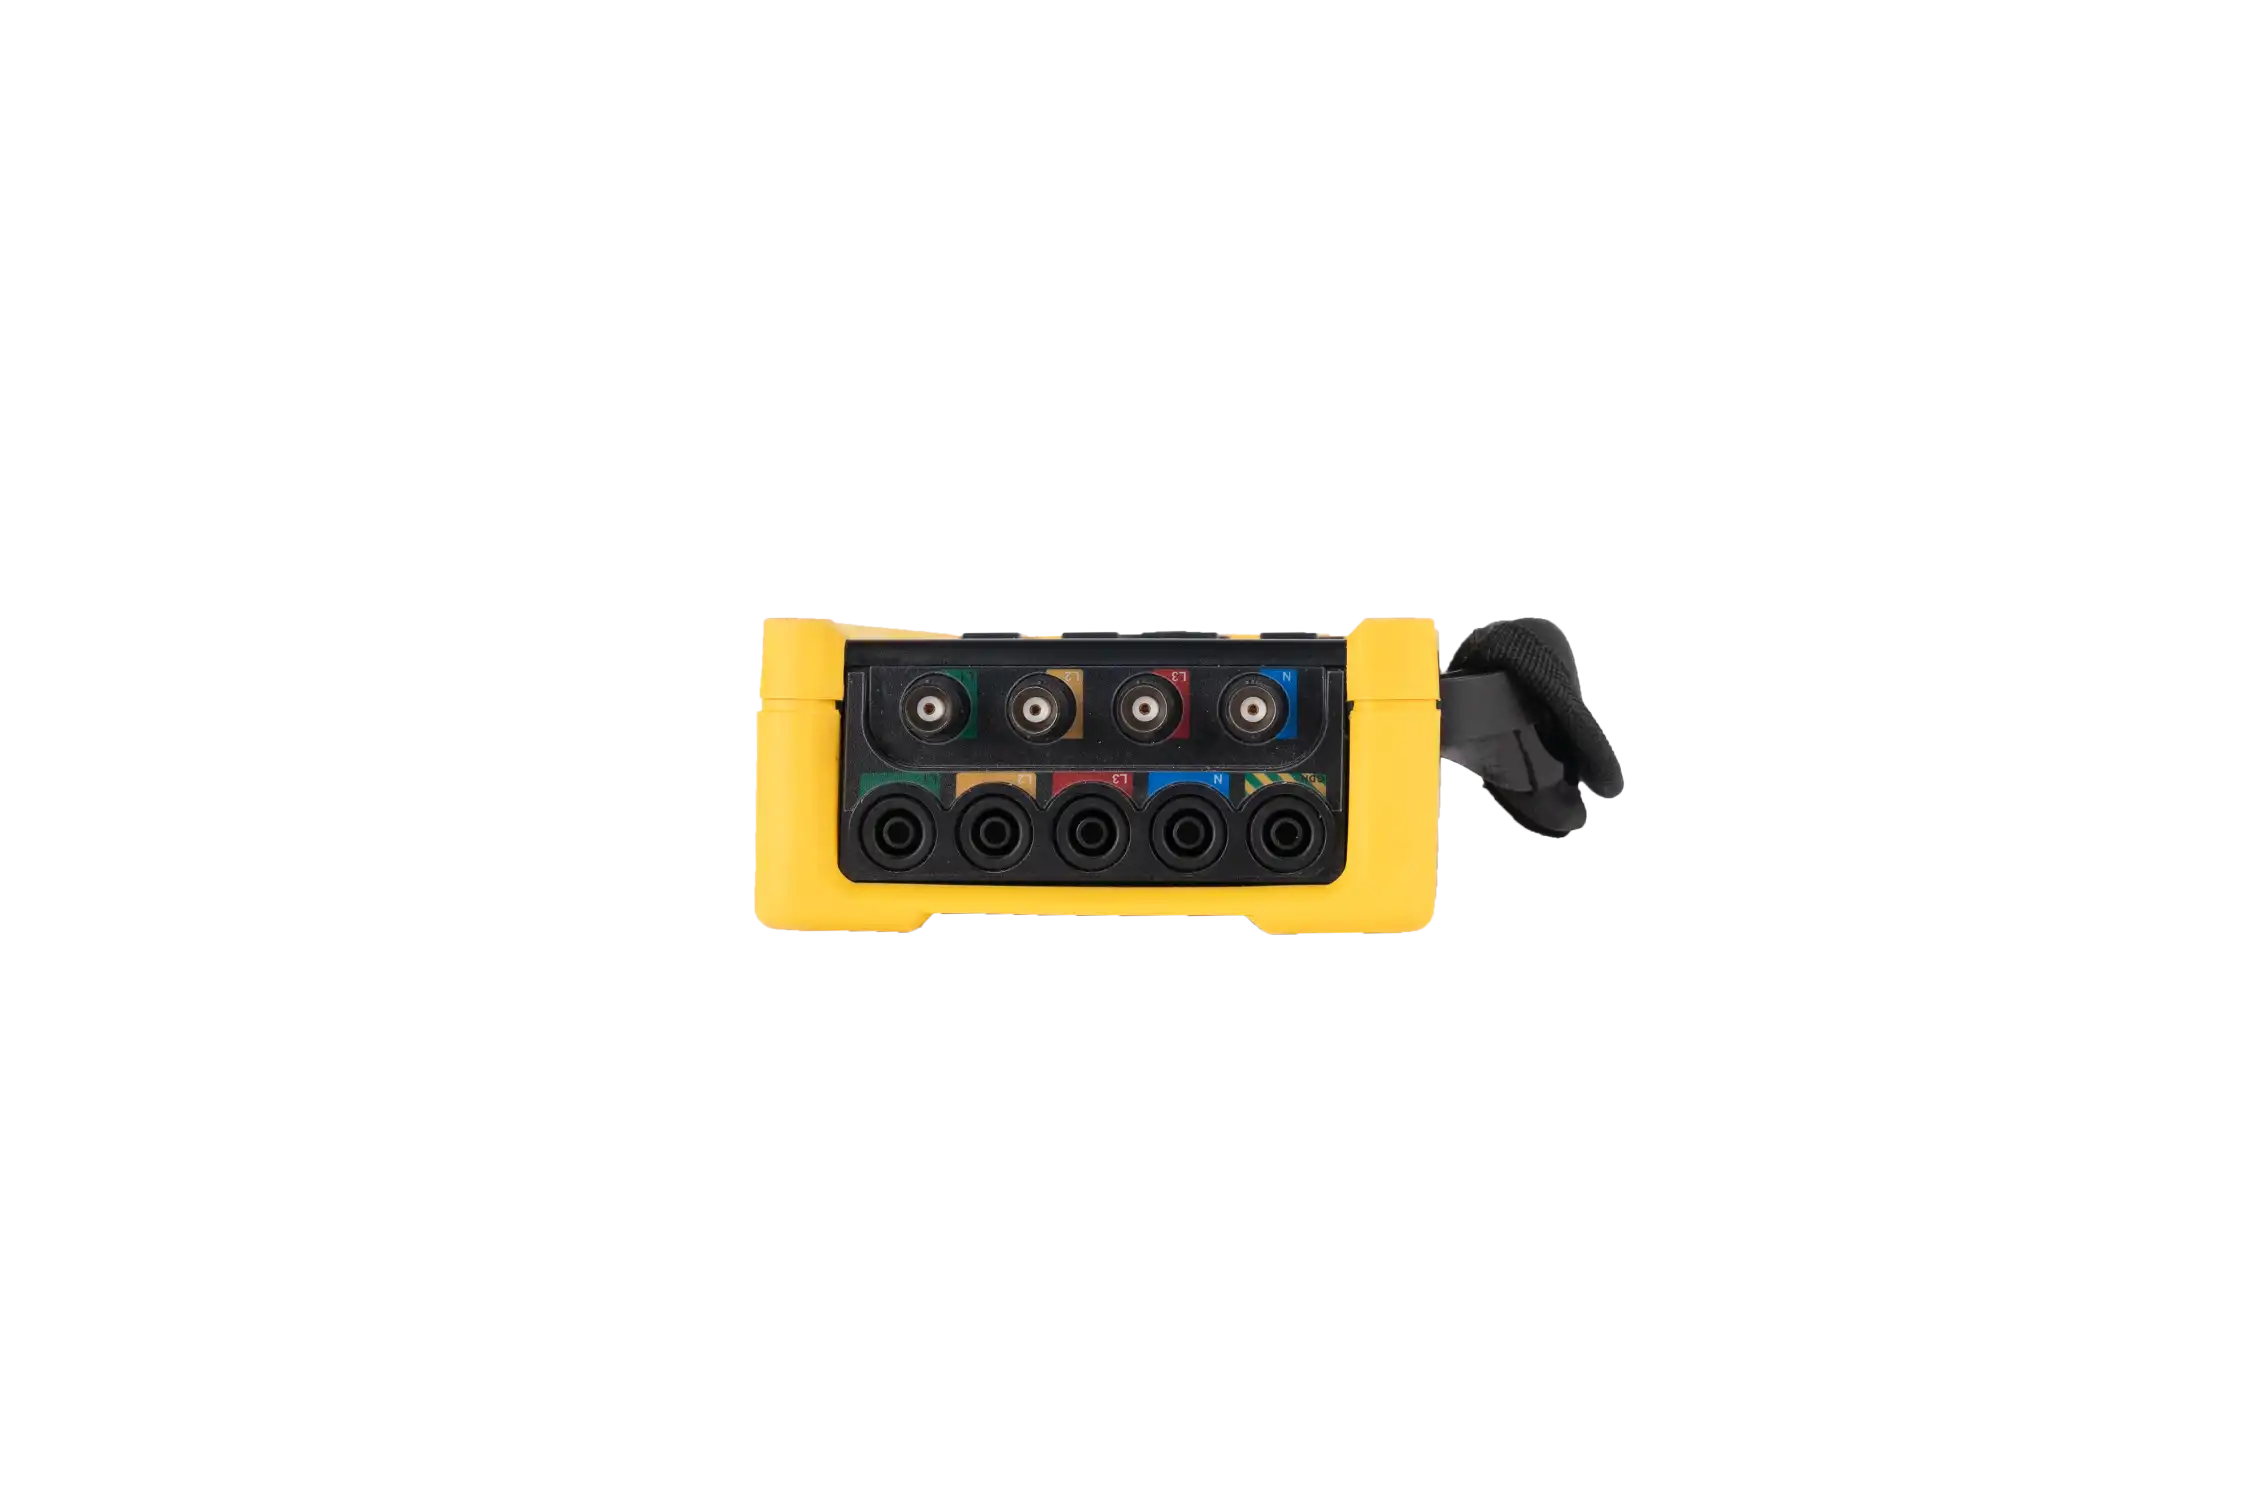
| Wiring Modes | 3P4W_4CT ; 3P4W_3CT 3P3W_3CT ; 3P3W_2CT 1P2W |
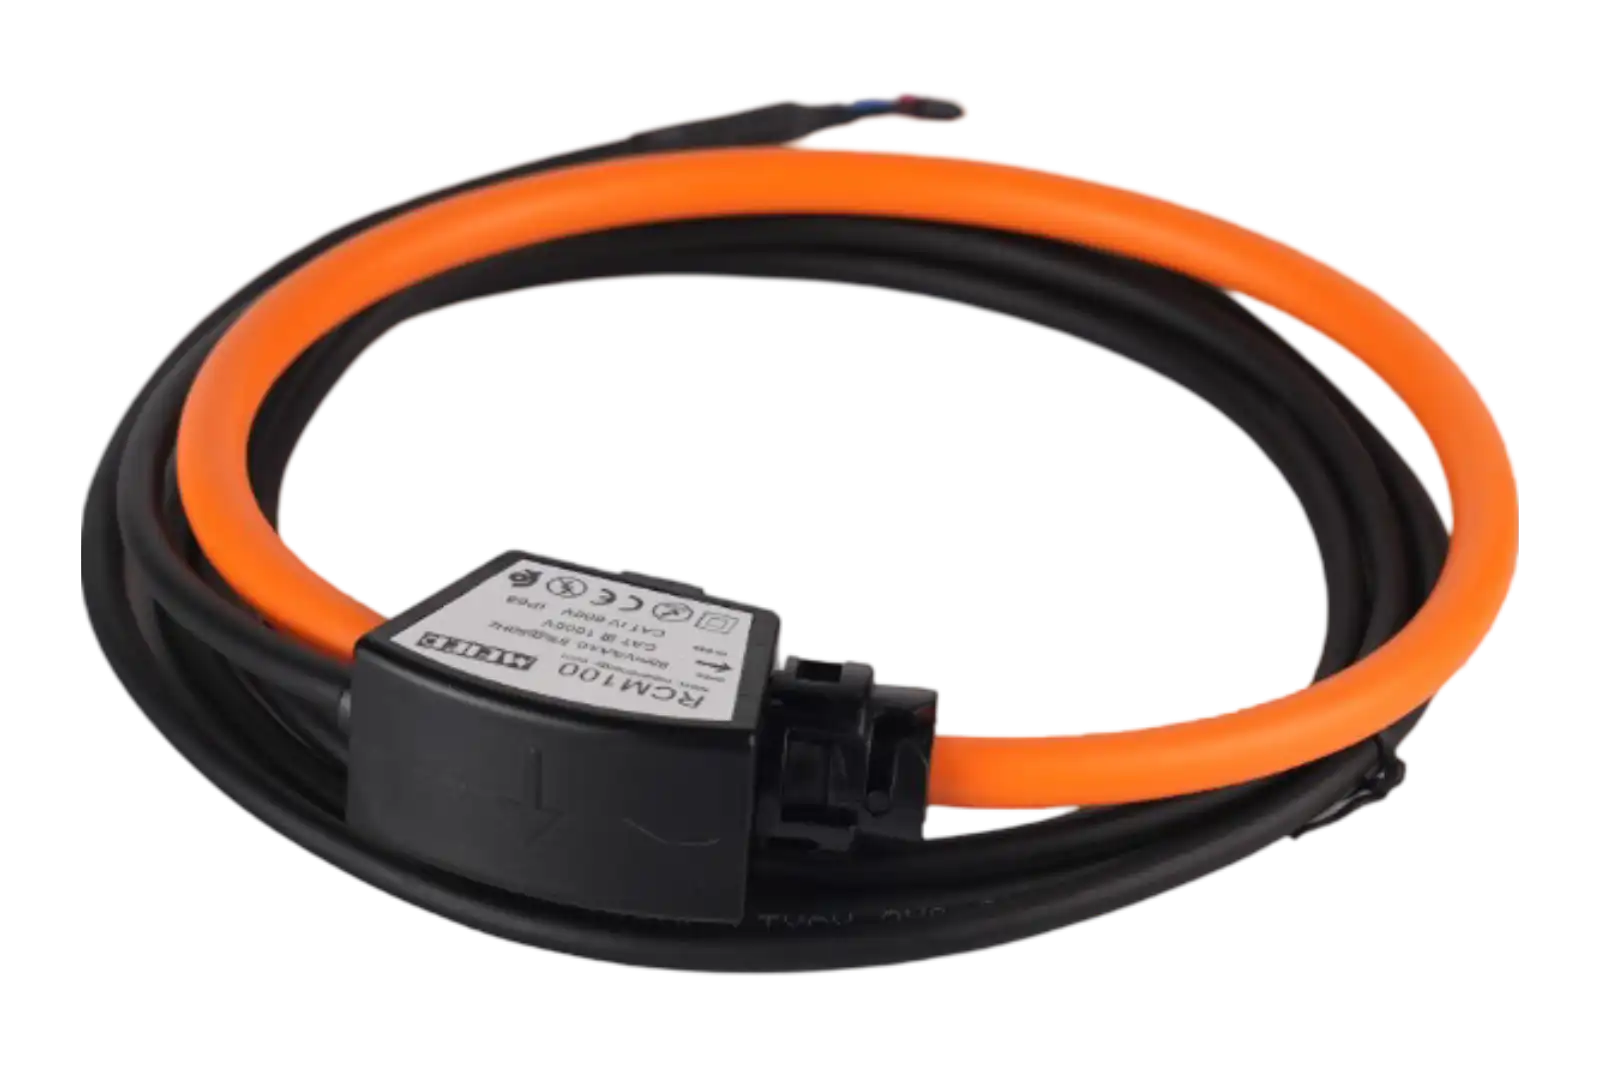
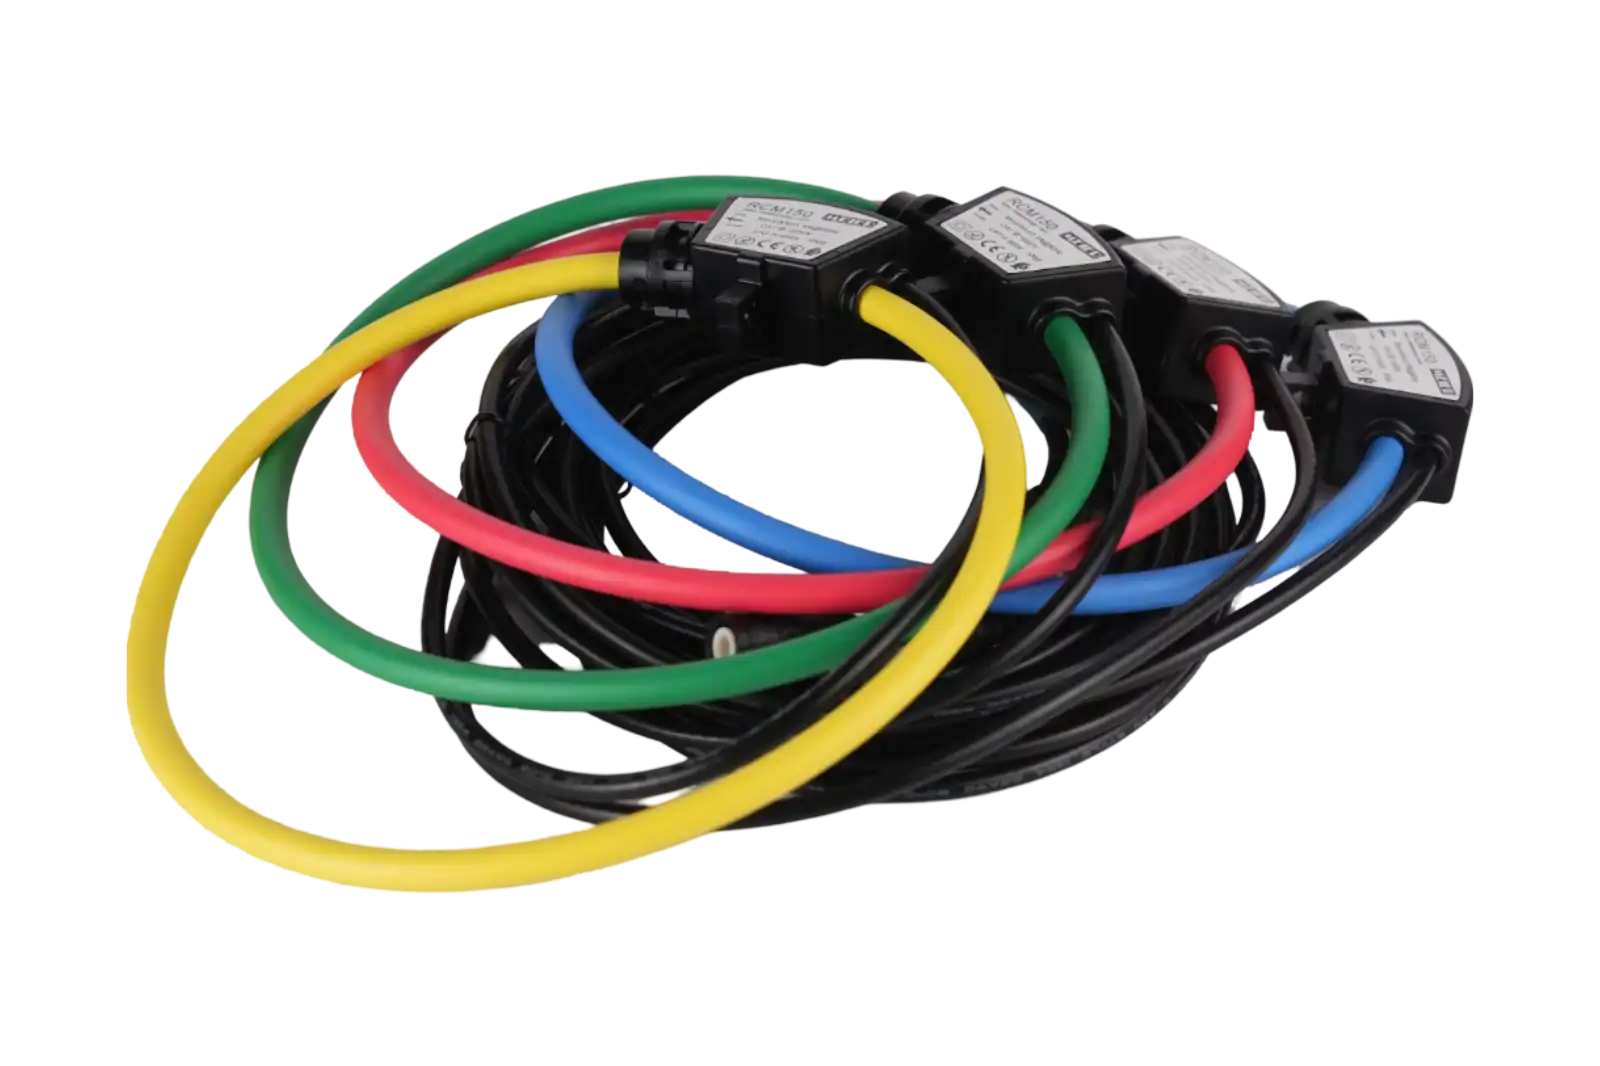
| Current Sensors | RCM-36: Rogowski Coil – diameter 36mm – up to 600A RCM-150: Rogowski Coil – diameter 150mm – up to 3000A RCM-200: Rogowski Coil – diameter 200mm – up to 6000A STM-10: Rigid clamp – diameter xxmm – 5A (for measurement on the secondary side of the current transformers existing in the installation) |
| Voltage Inputs | Direct measurement up to 600V Measurement on the secondary side of voltage transformers |
| Data storage | |
|---|---|
| Type | TF card |
| Capacity | 32GB |
| Data export | USB (FAT32 system) |
| Communication | |
|---|---|
| Interface | RJ45- Ethernet |
| Protocol | Modbus-TCP |
| Power supply | |
|---|---|
| Adapter | 230V- 50Hz / 5VDC, 2A |
| Battery | Rechargeable lithium battery, type 18650, 2 pcs, capacity 4000 mAh |
| Battery life | >= 6h |
| Charging time (powered off) | <= 5h |
| Power-saving mode | The brightness of the screen backlight is adjustable The automatic screen off delay is adjustable. |
| Display screen | |
|---|---|
| Dimensions | 3.97 inch |
| Type | IPS color display |
| Resolution | 480*800 pixels |
| Weight and dimensions | |
|---|---|
| Dimensions | 215*130*60mm |
| Weight | 850g |
| Environment | |
|---|---|
| Operating | Temperature-20°C~+55°C, Humidity < 90% RH |
| Storage | Temperature-40°C~+70°C, Humidity < 95% RH (without condensation) |
| Altitude | <= 2000 m |
| Safety standard | CAT III 600V according to IEC 61010-1 |
| Protection | IP30 |
Measurement
| Real-time measurement | |
|---|---|
| Voltage | Simple voltages: VL1, VL2, VL3 Neutral-to-ground voltage: VN Composite voltages: U12, U23, U31 Peaks of simple voltages and crest factor Peaks of composite voltages and crest factor |
| Current | Phase current: I1, I2, I3 et IN Crest factor of currents: Î1, Î2, Î3 K Factor per phase: L1, L2, L3 |
| Frequency | Line frequency |
| Power | Active Power: P1, P2, 33 and P total Reactive Power: Phases Q1, Q2, Q3 and Q total Distorting Power: Phases D1, D2, D3 and D total Apparent Power: Phase S1, S2, S3 and S total |
| Power factor | PF1, PF2, PF3 and PF total |
| Cosinus phi (DFP) | DPF1, DPF2, DPF3 and DPF total |
| Energy | Active Energy: per phase and total (import/export) Reactive Energy: per phase and total (import/export) Distorting Energy: per phase and total (import/export) Apparent Energy: per phase and total CO2 Emissions |
| Harmonic measurements | |
|---|---|
| Voltage harmonics | THD (Total Harmonic Distortion in %), TOHD (THD of odd harmonics in %), TEHD (THD of even harmonics in %) Individual harmonics from 1st to 50th on each phase L1, L2, and L3 in %, Individual harmonics in % from 1st to 50th on each phase in value |
| Current harmonics | THD (Total Harmonic Distortion in %), TOHD (THD of odd harmonics in %), TEHD (THD of even harmonics in %) Individual harmonics from 1st to 50th on each phase L1, L2, and L3 in %, Individual harmonics in % from 1st to 50th on each phase in value |
| Oscilloscope function | |
|---|---|
| Voltage waveform | Simple voltage waveform L1, L2, L3 or composite U12, U23, U31 |
| Current waveform | Current waveform per phase L1, L2, L3 |
| Phase shift and phase angle | |
|---|---|
| Voltage phase angle | Per phase L1, L2, L3 |
| Current phase angle | Per phase L1, L2, L3 |
| Phase shift between voltage and current | Per phase L1, L2, L3 |
| Unbalance | |
|---|---|
| Unbalance | Voltage unbalance, current unbalance |
| Maximum indicator (Demand) | |
|---|---|
| Power demand and peak demand | Maximum active power indicator per phase L1, L2, L3, and total. Maximum reactive power indicator per phase L1, L2, L3, and total. Maximum apparent power indicator per phase L1, L2, L3, and total. |
| Current Demand and Demand Peak | Per Phase L1L2L3 |
Data Logging
| Scope of use | |
|---|---|
| Recording parameters | – Recording name – Recording start date – Recording duration – Measurement interval |
| Basic Recorded Data | – Single voltages (ph-N and N-PE) – Composite voltages (ph-ph) – Currents – Frequency – Power factor per phase and total – Cos phi (fundamental power factor) per phase and total – Active, Reactive, Distortive, and Apparent Power – Active energy (Imported, Exported) – Reactive energy (Imported, Exported) – Distortive energy (Imported, Exported) – Apparent energy – Harmonic voltages (THD, THD of even orders, THD of odd orders) – Harmonic currents (THD, THD of even orders, THD of odd orders) – Voltage peaks – Voltage peak factor per phase – Current peak factor per phase – Current K factor per phase – Voltage imbalance (indirect and homopolar components) – Current imbalance (indirect and homopolar components) – Angle (phase voltage angle, phase current angle, angle between voltages, angle between currents, angle between voltages and currents) – Max min (Single voltage, Composite voltage, Current, Frequency, Power Factor, Fundamental Power Factor: cos phi, Active Power, Reactive Power, Apparent Power) – Maximum indicator: Demand (Current, Active Power, Reactive Power, Apparent Power) – Demand peak: IM Max (Current, Active Power, Reactive Power, Apparent Power) |
| Recording of harmonic voltages | Harmonic voltages (THD, TOHD of odd harmonics, TEHD of even harmonics, percentage and Value of voltage harmonics: 1st-50th) |
| Recording of harmonic currents | Harmonic currents (THD, TOHD of odd harmonics, TEHD of even harmonics, percentage and Value of current harmonics: 1st-50th) |
| Data recording format | |
|---|---|
| Data | CSV |
| Events | CSV |
| Waveform | CSV |
Measurement Accuracy
| Parameter | Type | Description |
|---|---|---|
| Voltage | Input Voltage Range | 0-600VAC |
| Measurement Range | 0-600VAC | |
| Measurement Accuracy | 0.2% | |
| Current | Input Voltage Range | 0-420mVAC |
| Measurement Range | RCM-36: 0 to 600A; RCM-150: 15 to 3000A; RCM-200: 30 to 6000A; STM-10: 0.01 to 5A |
|
| Measurement Accuracy | 0.2% + current sensor accuracy | |
| Frequency | Measurement Range | 45Hz-65Hz |
| Measurement Accuracy | +/-0.001 Hz | |
| Power Factor | Measurement Range | -1 to +1 |
| Measurement Accuracy | +/- 0.005 Hz | |
| Power | Active Power Accuracy | 0.5% |
| Reactive Power Accuracy | 1% | |
| Apparent Power Accuracy | 0.5% | |
| Energy | Active Energy Accuracy | 0.5% |
| Reactive Energy Accuracy | 1% | |
| Apparent Energy Accuracy | 0.5% |
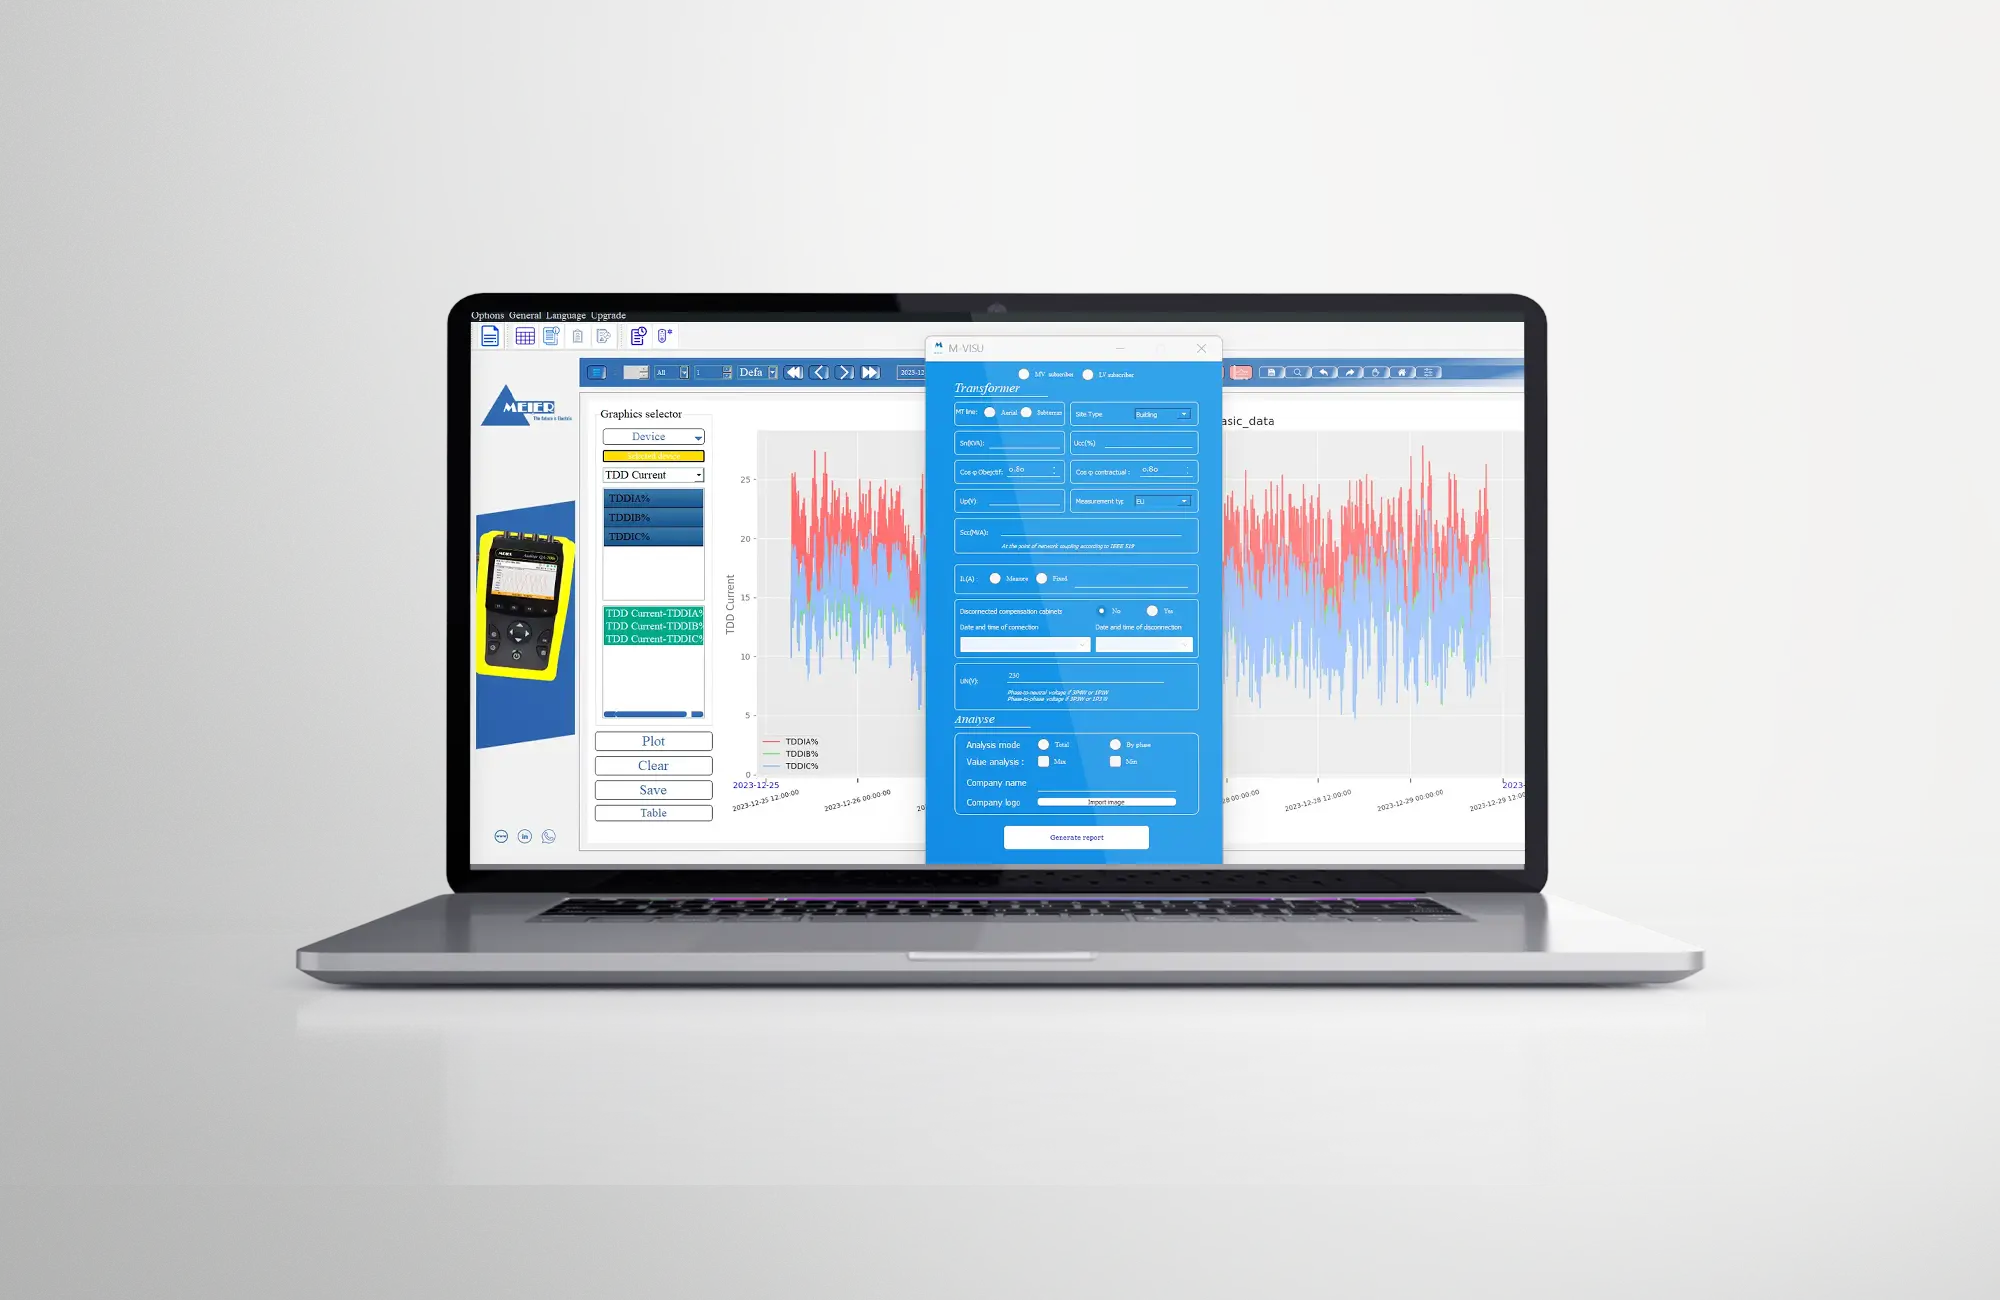
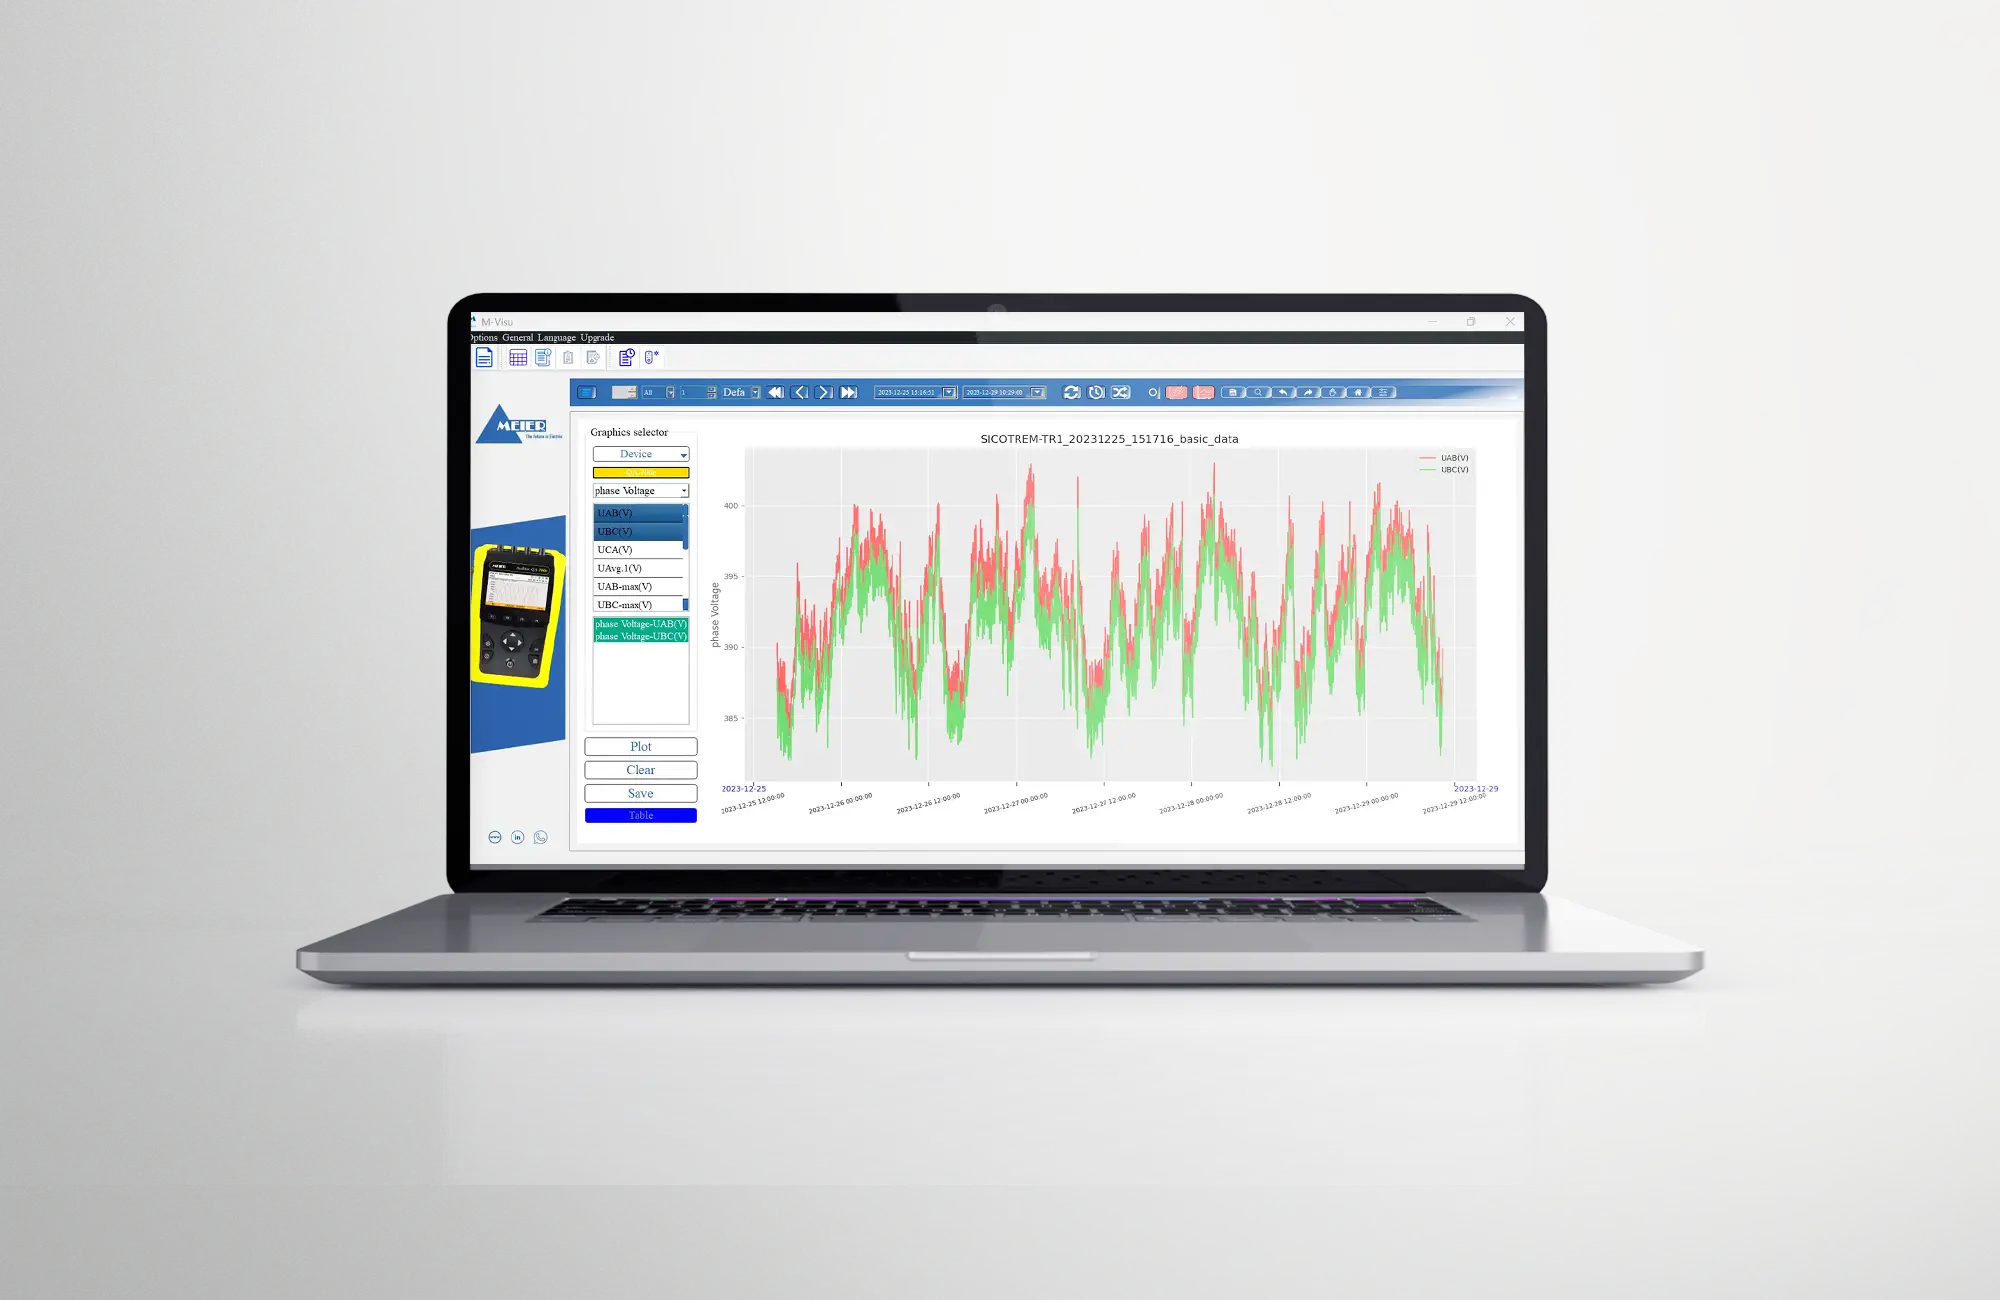
M-VISU Software
M-Visu is a powerful software package for analyzing and processing data recorded by Meier Energy measuring devices equipped with on-board memory, such as portable network analyzers, power meters with memory, weather stations, RTU, etc.
It allows precise visualization and analysis of recorded data, while offering advanced features such as automatic reporting.
M-Visu provides the flexibility and data analysis capabilities you need to make better maintenance and facility management decisions. With its advanced statistical analysis tools, M-Visu allows you to quickly identify trends, correlations, and anomalies in the recorded data. This essential feature helps optimize network performance and effectively resolve issues with electrical network analyzers.